Plug and play – practical steps for electrifying your terminal’s shuttle-carrier operations
Our webinar in May gave participants a host of practical tips on making the most of electrically powered shuttle-carrier technology, including how to figure out the optimal locations for charging stations using advanced terminal simulation tools. We’ve summarised the highlights for you in this article.
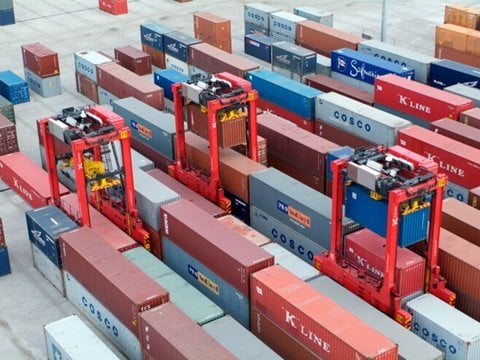
At Kalmar we’ve made no secret of our belief that the future of cargo-handling operations is most definitely electric – and our shuttle carrier, the workhorse that powers terminals the world over, is leading the charge towards an all-electric future thanks to Kalmar FastCharge™ technology.
The fast way to power up your terminal
Kalmar FastCharge is based on the same opportunity-charging technology used in electric buses, with charging taking place at strategically located stations during idle time in the machine’s working cycle.
“Thanks to high-powered charging we can drive up fleet utilisation rates significantly,” says Timo Alho, Vice President of Terminal Design Services at Kalmar. “The typical charging time during operation is just 30 to 180 seconds, so there’s no significant downtime to speak of,” he explains. “Of course, that’s on top of the fact that FastCharge eliminates emissions at source, reduces noise pollution and cuts maintenance costs too.”
A poll conducted during the webinar indicated that electrification is indeed on everyone’s minds. Of those who responded, 50% said they had investigated different concepts and 50% indicated they had already carried out some form of pre-investigation and calculations regarding electrification.
What’s your power budget?
The number-one priority when thinking about electrification is to determine the total per-hour energy consumption at your terminal, meaning consumption per typical work cycle of the machine multiplied by the number of work cycles performed per hour.
“There are two main factors that influence power consumption: travel distances in the terminal and the weight of the containers being handled,” Timo explains. “Once you have this data you can start moving forward with layout planning, and here optimisation is key.”

Location, location, location
Driving distances will vary depending on operational circumstances, and of course there might be additional driving to get to the charging stations, which takes up time and energy. In order to maximise the use of the charging stations we recommend that each station has two charging interfaces so that one machine can be charged while another is docking or leaving. “This kind of setup can achieve utilisation rates of 75 or perhaps even 80% with careful planning,” Timo highlights.
Safety, of course, is another priority – with charging stations located right at the heart of terminal operations it’s imperative to ensure safe access for maintenance teams without the need to pass through areas where equipment is operating. “One option that gives flexibility is that it’s possible to locate the charging interface up to 50 metres away from the station itself if needed,” explains Timo.
Charging stations naturally need a medium-voltage power supply, and this might mean additional civil works to install cabling at the required locations, or making a compromise in terms of location to minimise installation costs. “Even if a new terminal or expansion project is planned based on diesel-electric machines, it’s highly recommended to build electrification into the plans to avoid costly reworks in the future,” Timo points out.
Finally, there are driving patterns to think about too – in a nutshell, how should the charging point be located to ensure safe, efficient entry and exit for the machines, which may “drive through” and continue in the same direction after charging, or enter forwards and reverse out in a “dead-end” setup.
"We recommend that each station has two charging interfaces so that one machine can be charged while another is docking or leaving"
Timetable and drivers for electrification
When we asked the webinar participants to give us their thoughts about how soon they’d expect to go fully electric, responses were split into two clear camps: 50% said they expect to do so within two to three years and 50% said it would take more than 10 years.
In terms of drivers, fuel costs and company sustainability strategy were the clear winners; in addition, all respondents said that they would implement electrification in some form in combination with the adoption of automation.
Predicting the future with simulation
To bring things to life we performed simulation scenarios to investigate the impact of introducing FastCharge on ship-to-shore (STS) crane performance and to estimate the ratio between charging stations, interfaces and FastCharge shuttles. The simulation was based on an operational model with seven STS cranes, 14 automatic stacking crane (ASC) blocks and 20 shuttles. The charging stations had two charging posts and were located at the entry point to the ASC operating area to eliminate the need for additional driving.
“We included energy modelling to look at time and distance-based consumption using real operational data to make it as realistic as possible,” Timo explains. “In the simulation we ran three scenarios for the 20 shuttle carriers: one with all diesel-electric hybrid shuttles; a mixed-fleet scenario with 10 diesel and 10 FastCharge shuttles served by two charging stations, each with two charging interfaces; and a third with all 20 machines as FastCharge models served by three charging stations, also with two charging interfaces.”
For the diesel-electric scenario we saw the average operational productivity for the STS cranes was 26.2 moves per hour. The mixed-fleet scenario showed a slight increase in productivity at 27.4 moves per hour; this was due to reduced congestion because the shuttles had to exit the STS operating area for charging. Finally, in the full FastCharge fleet scenario the productivity was slightly lower, at 25.2 moves per hour.
“In terms of power consumption, driving distances and moves per hour the shuttle carrier types were pretty much equal, with the fully electric fleet coming in slightly lower for moves per hour.” Timo says. “When we look at activity splits, although the mixed and fully electric fleets spent about 10–12% of their time at the charging stations their activity rate was not that different from the diesel-electric hybrids because the idle waiting time was spent charging.
Leading the way towards fully electric operations
Kalmar FastCharge is currently the only commercially available technology for electrifying shuttle and straddle carrier operations. In order to get the most from the solution it’s critical to build up a deep understanding of the operational details and thoroughly evaluate the proposed layouts to help identify the right choice for the terminal in question.
“Even though we have to account for the machines spending around 12% of their time charging, the impact on STS productivity is minimal. The simulations we ran show the importance of thorough planning, and this is where Kalmar’s expert teams can help because we are much more than just an equipment supplier,” Timo concludes.
Related articles
Further reading
Subscribe and receive updates in your email
Subscribe